Editor’s Note
A recent article by Tsinghua University researcher Huang Zhen Ping (黄真平), published in Chinese, analyzes the statistics related to foreign NGOs registering in China under the framework of the Overseas NGO Law, which went into effect in January 2017. The article refers to the statistics for the period from January to the end of September 2017. Below you can find our translation of the graphs from the original article, accompanied by our own explanations of the findings.
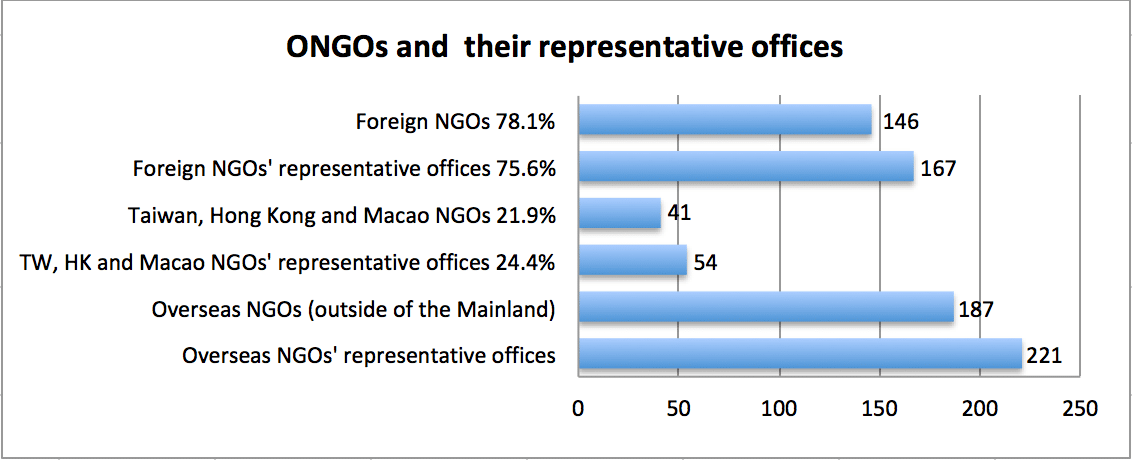
The registration of ONGOs’ representative offices
By the end of September, a total of 146 foreign NGOs (国外非政府组织) had established a total of 167 representative offices (it must be remembered that one NGO can establish more than one representative office). Meanwhile, 41 NGOs from Taiwan, Hong Kong and Macau had established a total of 54 offices. This means that a total of 187 overseas NGOs (境外非政府组织), a designation including any NGO from outside of Mainland China, had established a total of 221 representative offices.
The table below provides the figures for the number of ONGOs and the number of representative offices for every country and region involved.
| No. | Country/Region | Number of Overseas NGOs | % | Number of registered representative offices | % |
| 1 | Taiwan | 6 | 3.2% | 7 | 3.2% |
| 2 | Hong Kong | 32 | 17.1% | 44 | 19.9% |
| 3 | Macau | 3 | 1.6% | 3 | 1.4% |
| Subtotal | 41 | 21.9% | 54 | 24.4% | |
| 1 | United States | 55 | 29.4% | 58 | 26.2% |
| 2 | Japan | 28 | 15.0% | 31 | 14.0% |
| 3 | South Korea | 12 | 6.4% | 16 | 7.2% |
| 4 | Germany | 10 | 5.3% | 15 | 6.8% |
| 5 | United Kingdom | 6 | 3.2% | 9 | 4.1% |
| 6 | Switzerland | 7 | 3.7% | 8 | 3.6% |
| 7 | Canada | 5 | 2.7% | 6 | 2.7% |
| 8 | France | 5 | 2.7% | 5 | 2.3% |
| 9 | Australia | 3 | 1.6% | 3 | 1.4% |
| 10 | India | 1 | 0.5% | 2 | 0.9% |
| 11 | Italy | 2 | 1.1% | 2 | 0.9% |
| 12 | Malaysia | 2 | 1.1% | 2 | 0.9% |
| 13 | Belgium | 2 | 1.1% | 2 | 0.9% |
| 14 | New Zealand | 1 | 0.5% | 1 | 0.5% |
| 15 | Singapore | 1 | 0.5% | 1 | 0.5% |
| 16 | Spain | 1 | 0.5% | 1 | 0.5% |
| 17 | Turkey | 1 | 0.5% | 1 | 0.5% |
| 18 | Mongolia | 1 | 0.5% | 1 | 0.5% |
| 19 | Russia | 1 | 0.5% | 1 | 0.5% |
| 20 | Denmark | 1 | 0.5% | 1 | 0.5% |
| 21 | United Arab Emirates | 1 | 0.5% | 1 | 0.5% |
| Subtotal | 146 | 78.1% | 167 | 75.6% | |
| Total | 187 | 100% | 221 | 100% | |
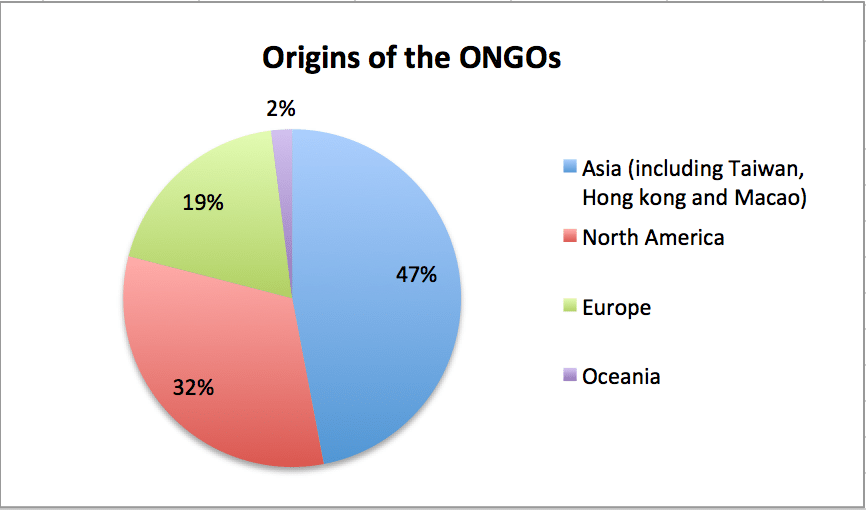
The origins of the overseas NGOs by continent
47% of the ONGOs to have registered are from Asia, 32% from North America, 19% from Europe and 2% from Oceania.
The table below provides the figures for the number of ONGOs and representative offices for every continent.
| Location | Number of ONGOs | % | Number of registered representative offices | % |
| Asia (including Taiwan, Hong Kong and Macao) | 88 | 47.1% | 109 | 49.3% |
| Europe | 35 | 18.7% | 44 | 19.9% |
| North America | 60 | 32.1% | 64 | 29.0% |
| Oceania | 4 | 2.1% | 4 | 1.8% |
| Total | 187 | 100.0% | 221 | 100.0% |
| Asia (excluding Taiwan, Hong Kong and Macao) | 47 | 25.1% | 55 | 24.9% |
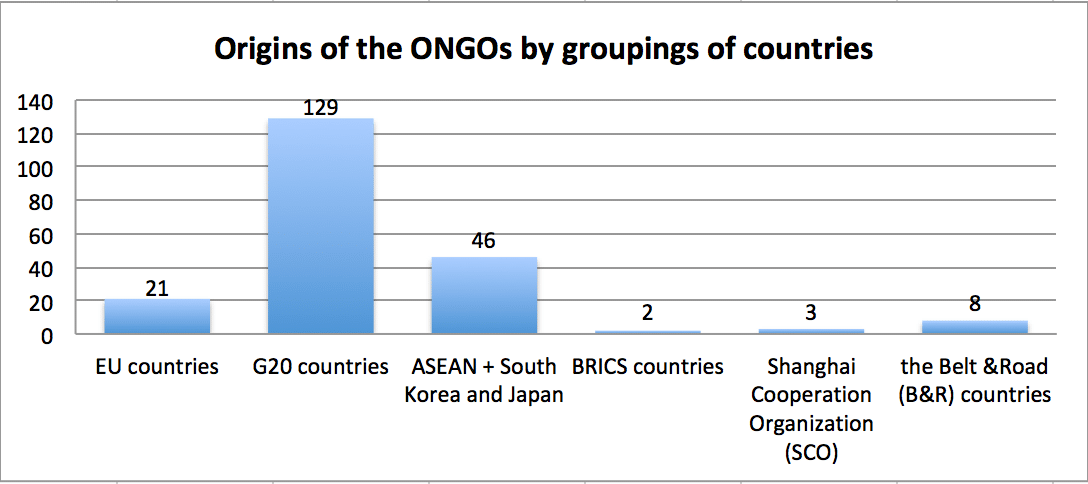
The origins of the overseas NGOs by international organizations
This graph looks at how ONGOs are distributed by supranational organizations. It is perhaps not surprising that 129 of the ONGOs come from the G20 countries. What is more striking is that only 2 of the registered ONGOs come from the BRICS group of large emerging economies (obviously excluding China itself). ASEAN is grouped together with South Korea and Japan, as is common practice in China.
The table below shows the distribution of ONGOs and their Representative Offices by international organizations.
| International organization | Number of ONGOs | % | Number of registered representative offices | % |
| European countries | 21 | 11.2% | 26 | 11.8% |
| G20 countries | 129 | 69.0% | 149 | 67.4% |
| ASEAN and surrounding countries | 46 | 24.6% | 54 | 24.4% |
| BRICS countries | 2 | 1.1% | 3 | 1.4% |
| Shanghai Cooperation Organization (SCO) | 3 | 1.6% | 4 | 1.8% |
| the Belt &Road (B&R) countries | 8 | 4.3% | 9 | 4.1% |
The fields of work of the representative offices
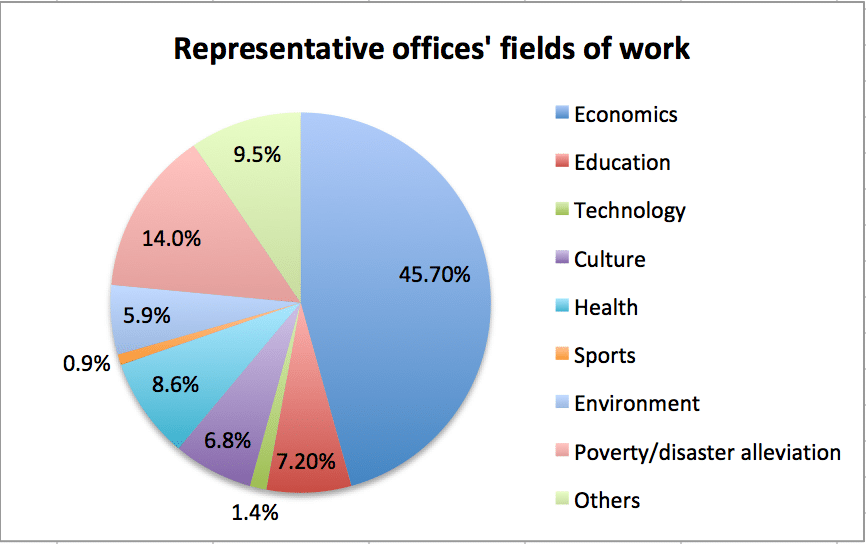
The most common field of work by far is economics, with 101 representative offices, or 45.7% of the total, that have this field as their official focus. This probably reflects the large number of chambers of commerce and trade organizations that have registered under the Overseas NGO Law.
| No. | Fields of work | Number of ONGOs | % |
| 1 | Economics | 101 | 45.70% |
| 2 | Education | 16 | 7.20% |
| 3 | Technology | 3 | 1.4% |
| 4 | Culture | 15 | 6.8% |
| 5 | Health | 19 | 8.6% |
| 6 | Sports | 2 | 0.9% |
| 7 | Environment | 13 | 5.9% |
| 8 | Poverty/disaster alleviation | 31 | 14.0% |
| 9 | Others | 21 | 9.5% |
| Total | 221 | 100% | |
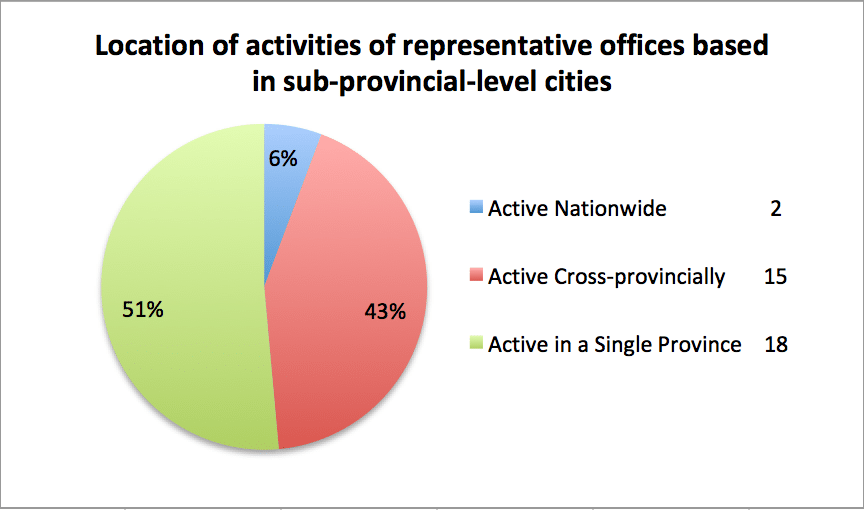
Location of activities for representative offices based in cities below the province-level
Out of the total of 221 representative offices, there are 35 whose name makes reference to a city below the provincial level. All the others are tied to the name of a province, or a directly-controlled municipality with equal status to a province, of which there are four: Beijing, Shanghai, Tianjin and Chongqing. Looking at the official location of the activities of these 35 representative offices, it can be seen that 18 are responsible for single-province activities, 15 are responsible for cross-provincial activities, and 2 for nationwide activities. This shows that it is possible for a representative office whose name refers to a city below the provincial level to still carry out activities in other provinces and nationally.
| No. | Province | Representative offices’ names | Number | Locations of activity |
| 1 | Guangdong | Guangzhou | 5 | 4 cross-province, 1 within-province |
| Shenzhen | 3 | within-province | ||
| Shunde | 1 | within-province | ||
| 2 | Fujian | Xiamen | 1 | within-province |
| Quanzhou | 1 | within-province | ||
| 3 | Liaoning | Shenyang | 3 | cross-province |
| Dalian | 3 | cross-province | ||
| 4 | Jiangsu | Nanjing | 1 | cross-province |
| Mountain Kun, Suzhou | 1 | within China | ||
| 5 | Gansu | Lanzhou | 1 | cross-province |
| 6 | Hubei | Wuhan | 2 | cross-province or within-province |
| 7 | Hunan | Changsha | 1 | within-province |
| 8 | Jilin | Yanji | 1 | within-province |
| 9 | Shandong | QIngdao | 3 | cross-province, within-province or within China |
| 10 | Sichuan | Chengdu | 1 | cross-province |
| 11 | Xizang | Lasa | 1 | within-province |
| 12 | Yunnan | Kunming | 5 | within-province |
| 13 | Zhejiang | Hangzhou | 1 | within-province |
| Total | 35 | 15.8% of the representative offices in China | ||
Locations of the representative offices’ activities
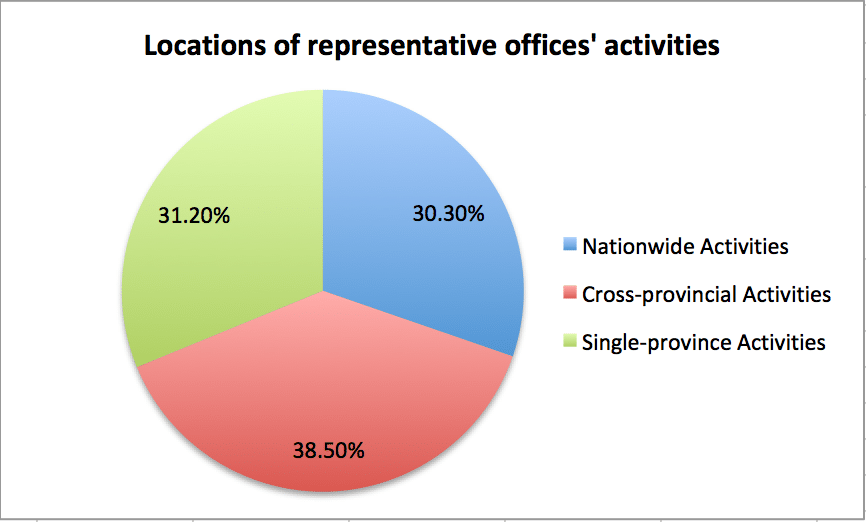
According to the figures regarding the representative offices’ official scope of activities, there is a fairly even distribution between cross-provincial activities (38.5%), single-province activities (31.2%) and nationwide activities (30.3%).
Registrations by month
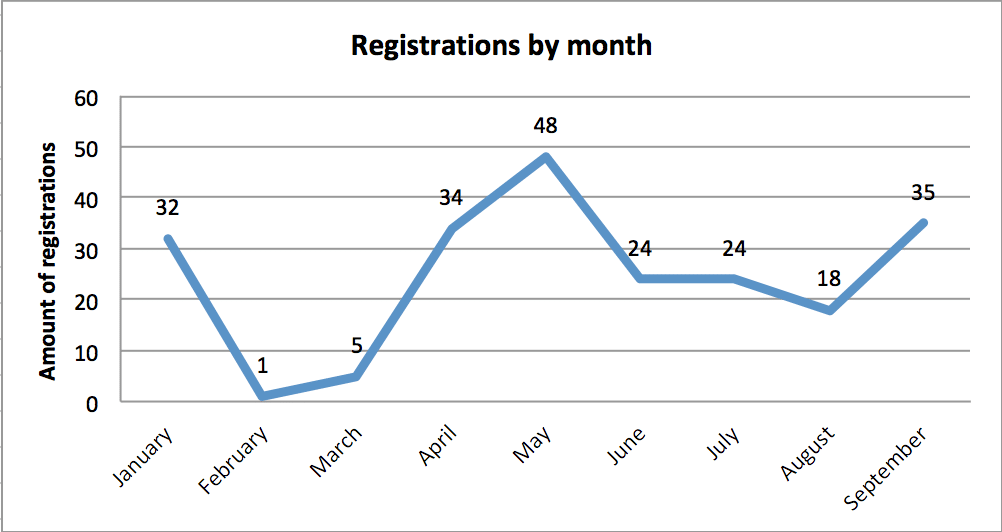
As can be seen, a fair number of NGOs registered in January (mostly because they were already registered with the Ministry of Civil Affairs), followed by a slowdown in February and March. Registrations picked up again in April and reached a peak in May, followed by a relative slowdown throughout the summer and another increase in September.
Filings of temporary activities
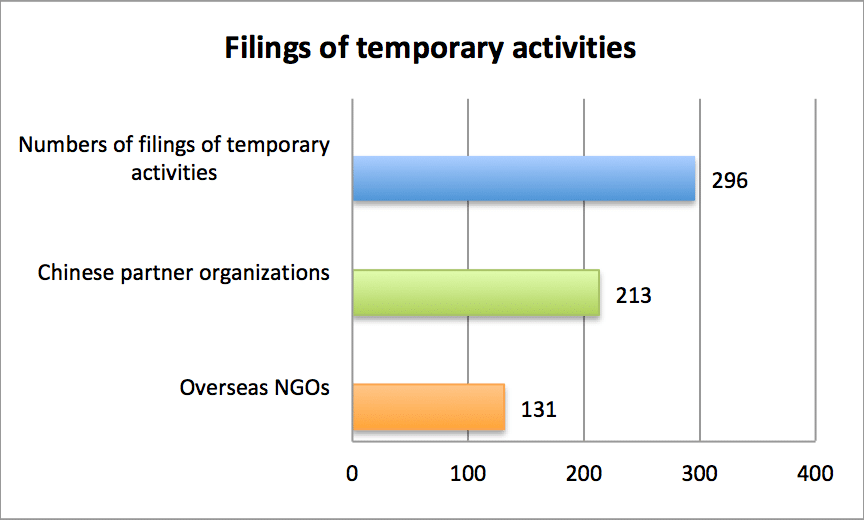
A total of 296 filings of temporary activities were registered. 131 overseas NGOs and 213 Chinese partner organizations were involved in filing the activities.
The Chinese partner organizations for temporary activities
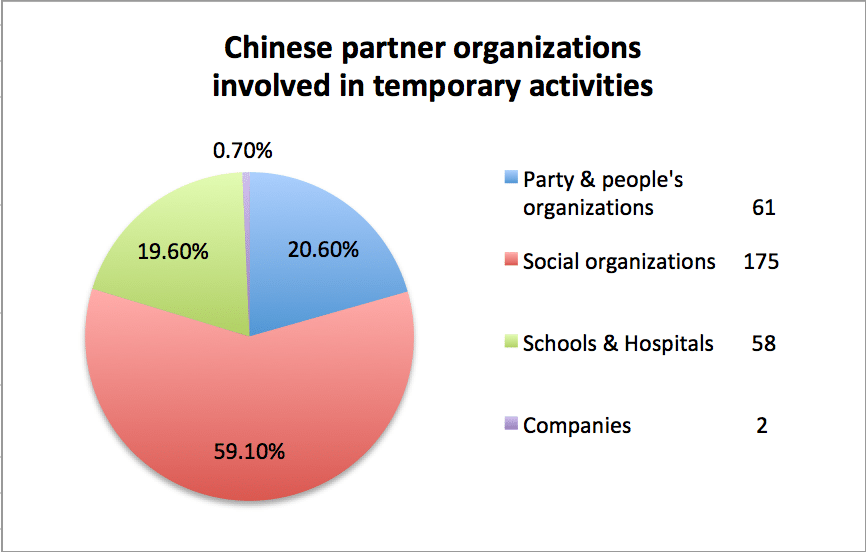
Social organizations predominate among the local partner organizations for temporary activities, with 175 (59.1% of the total), followed by Party & people’s organizations with 61 and schools and hospitals with 58.
Fields of work for temporary activities
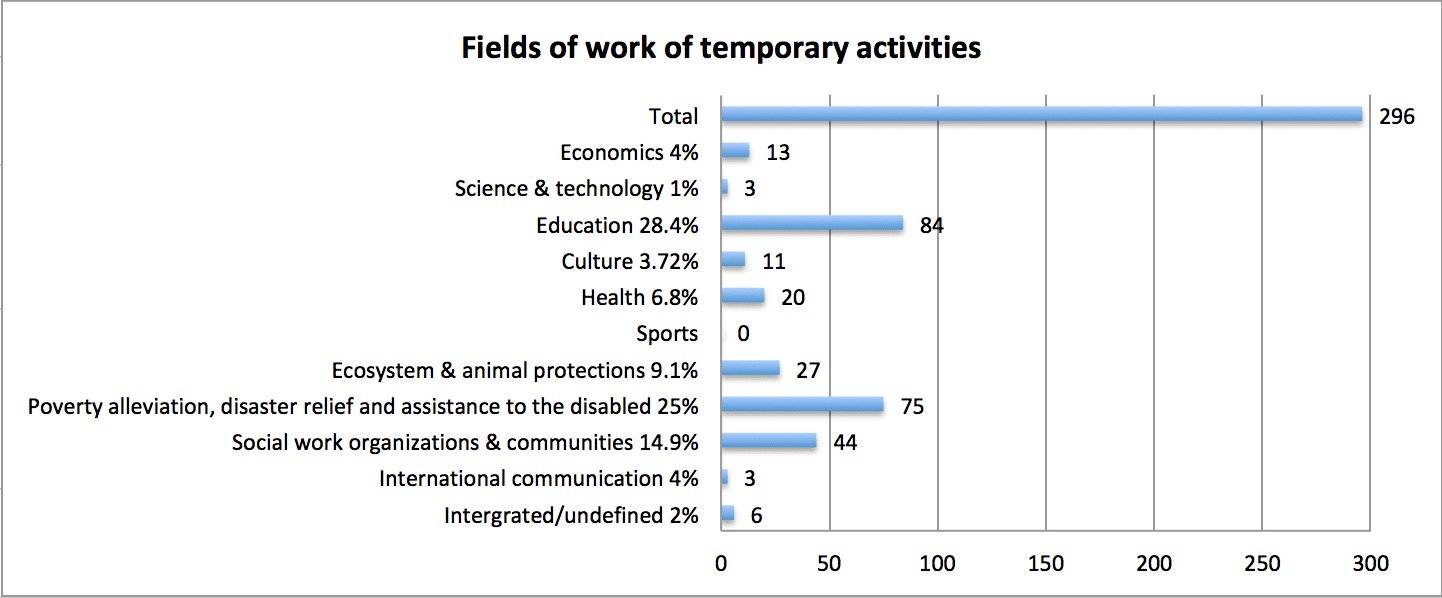
Education is the most common field of work under which the temporary activities were filed, with 84 filings, closely followed by “poverty alleviation, disaster relief and assistance to the disabled” with 75 filings.
Locations of the temporary activities
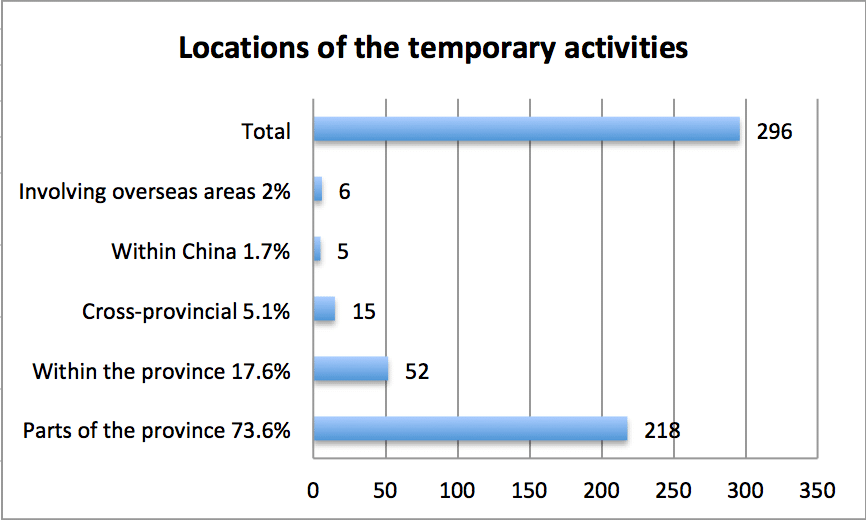
A majority of the filed temporary activities were limited in their territorial scope, with 218 or 73.6% of the total taking place in just a part or parts of a single province.
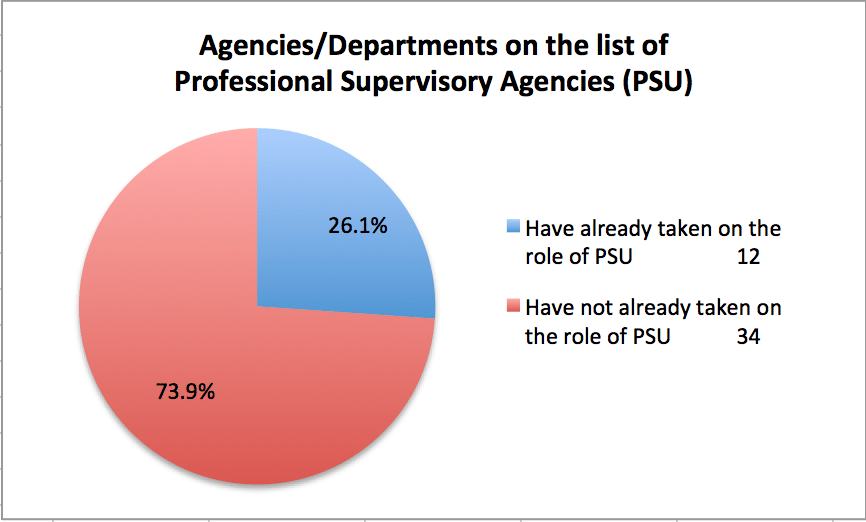
Agencies/departments on the list of Professional Supervisory Agencies (PSU)
Out of the 46 agencies and departments mentioned in the list of potential PSUs released by the MPS last December, 12 have already taken on the role of PSU, accounting for 26% of the total. Since then another five agencies or departments not included in the original list have taken on the role of PSUs, bringing the total up to 17.
The table below shows the distribution of the Representative Offices registered under PSUs belonging to the State Council’s related departments and organizations.
| No. | Department | Number of ONGOs supervised | % | Registration sites of representative offices | ||||||
| Beijing | Shanghai | Jiangsu | Guangxi | Shaanxi | Shandong | Guangdong | ||||
| 1 | Ministry of Civil Affairs | 11 | 18% | 9 | 2 | |||||
| 2 | The Chinese People’s Association for Friendship with Foreign Countries | 9 | 14.8% | 9 | ||||||
| 3 | The State Administration of Press Publication, Radio, Film and Television (Copyright) | 7 | 11.5% | 7 | ||||||
| 4 | State Forestry Bureau | 6 | 9.8% | 6 | ||||||
| 5 | Oversea Chinese Affairs Office of the State Council | 5 | 8.2% | 1 | 1 | 1 | 1 | 1 | ||
| 6 | National Health and Family Planning Commission | 5 | 8.2% | 5 | ||||||
| 7 | the State Administration of Grain | 3 | 4.9% | 3 | ||||||
| 8 | Ministry of Environmental Protection | 3 | 4.9% | 3 | ||||||
| 9 | National Development and Reform Commission | 3 | 4.9% | 3 | ||||||
| 10 | Ministry of Education | 2 | 3.3% | 1 | 1 | |||||
| 11 | China National Tourism Administration | 1 | 1.6% | 1 | ||||||
| 12 | China Association for International Understanding | 1 | 1.6% | 1 | ||||||
| 13 | China Disabled Persons Federation | 1 | 1.6% | 1 | ||||||
| 14 | State Post Bureau | 1 | 1.6% | 1 | ||||||
| 15 | General Administration of Sport | 1 | 1.6% | 1 | ||||||
| 16 | State Ethnic Affairs Commission | 1 | 1.6% | 1 | ||||||
| 17 | Ministry of Land and Resources | 1 | 1.6% | 1 | ||||||
| Total | 61 | 53 | 1 | 1 | 1 | 1 | 1 | 3 | ||
Comparison between State Council and provincial government departments/organizations
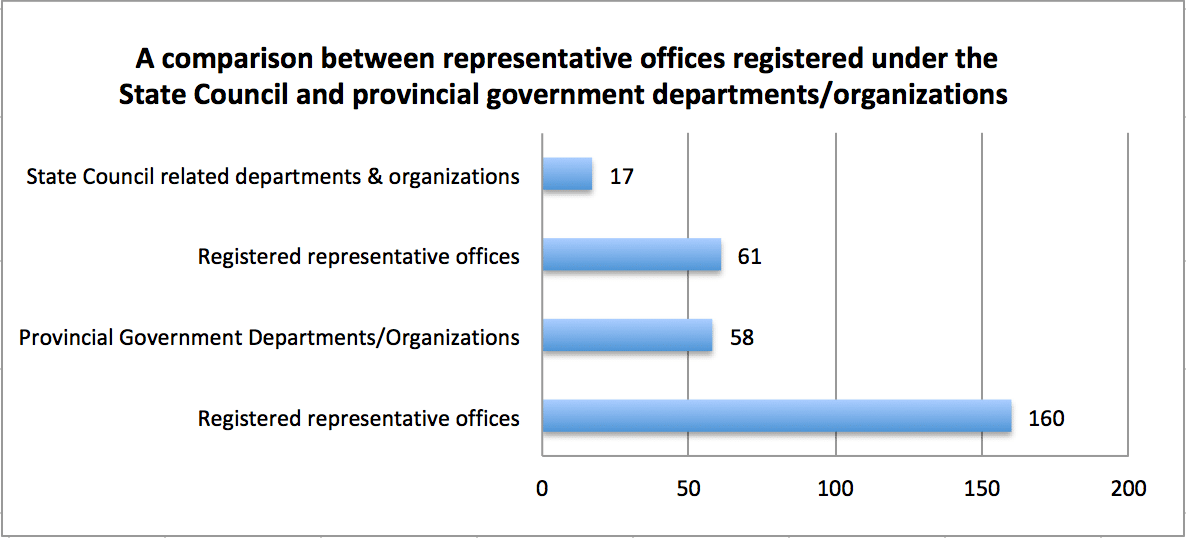
As can be seen, 61 representative offices were established with 17 State Council departments (部门) or units (单位) as their PSUs. 160 representative offices were established with 58 provincial government departments or units as their PSUs. The provincial governments of a total of 24 provinces have provided PSUs.
The table below shows the distribution of PSUs and Representative Offices by province.
| Province | Number of provincial level PSUs | Related departments | Total number of registered representative offices | |
| Provincial level | State Council | |||
| Number of representative offices | ||||
| Yunnan | 5 | 17 | 17 | |
| Sichuan | 5 | 7 | 7 | |
| Fujian | 5 | 6 | 6 | |
| Shanghai | 4 | 50 | 1 | 51 |
| Beijing | 4 | 21 | 53 | 74 |
| Guangdong | 3 | 11 | 3 | 14 |
| Tianjin | 3 | 8 | 8 | |
| Shanxi | 3 | 3 | 1 | 4 |
| Shandong | 3 | 3 | 1 | 4 |
| Chongqing | 3 | 3 | 3 | |
| Gansu | 2 | 4 | 4 | |
| Jiangsu | 2 | 3 | 1 | 4 |
| Hunan | 2 | 3 | 3 | |
| Heilongjiang | 2 | 2 | 2 | |
| Guangxi | 2 | 2 | 1 | 3 |
| Hubei | 2 | 2 | 2 | |
| Liaoning | 1 | 8 | 8 | |
| Zhejiang | 1 | 1 | 1 | |
| Tibet | 1 | 1 | 1 | |
| Inner Mongolia | 1 | 1 | 1 | |
| Jiangxi | 1 | 1 | 1 | |
| Jilin | 1 | 1 | 1 | |
| Henan | 1 | 1 | 1 | |
| Guizhou | 1 | 1 | 1 | |
| Total | 58 | 160 | 61 | 221 |
The table below shows the distribution of PSUs and representative offices within the different administrative categories.
| No. | Professional Supervisory Units (PSU) | Number of PSUs | Number of registered representative offices |
| 1 | Departments of Commerce | 17 | 95 |
| 2 | Departments of Civil Affairs | 10 | 28 |
| 3 | Departments of Health and Family Planning | 9 | 22 |
| 4 | Departments of Education | 9 | 13 |
| 5 | Departments of Friendship with Foreign Countries | 1 | 9 |
| 6 | Departments of Forestry | 3 | 8 |
| 7 | Departments of Press, Publication, Radio, Film and Television | 1 | 7 |
| 8 | Departments of Foreign Affairs | 1 | 1 |
| 9 | Departments of Overseas Chinese Affairs | 1 | 5 |
| 10 | Departments of Poverty Alleviation | 2 | 5 |
| 11 | Departments of Environmental Protection | 2 | 4 |
| 12 | Departments of Development and Reform | 1 | 3 |
| 13 | Departments of Grain | 1 | 3 |
| 14 | Departments of Agriculture | 2 | 2 |
| 15 | Departments of Sports | 2 | 2 |
| 16 | Departments of Culture | 2 | 2 |
| 17 | State Ethnic Affairs Commission | 1 | 1 |
| 18 | Departments of Land and Resources | 1 | 1 |
| 19 | Departments of Technology | 1 | 1 |
| 20 | Departments of Tourism | 1 | 1 |
| 21 | Departments of Post | 1 | 1 |
| 22 | Economic and information systems | 1 | 2 |
| 23 | Departments of Trade Union | 1 | 1 |
| 24 | Departments of Women’s Association | 1 | 1 |
| 25 | Departments of Protection of Disabled Persons | 1 | 1 |
| 26 | Public Institutions | 1 | 1 |
| 27 | Social Organizations | 1 | 1 |
| Total | 75 | 221 | |
Locations of the activities of the representative offices registered under PSUs from the State Council departments & organizations
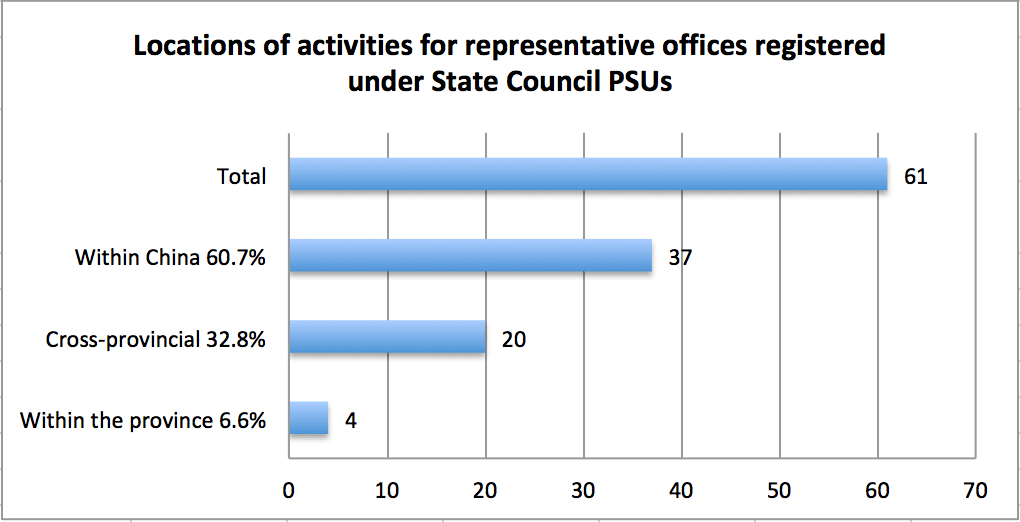
Out of the representative offices to have a State Council department or unit as their PSU, 37 have the whole of China as their registered field of activities, 20 are cross-provincial, and only 4 are limited to a single province.
The PSUs of the representative offices with nationwide activities
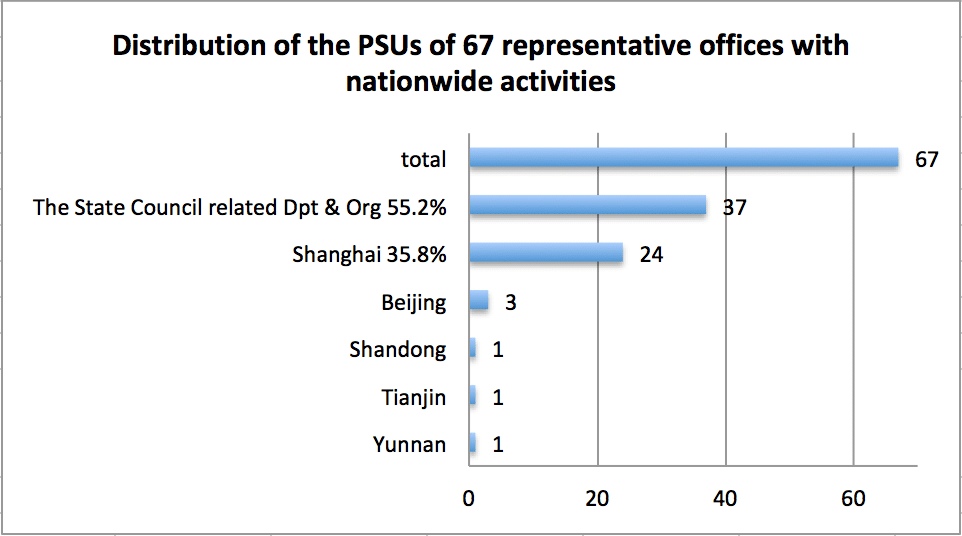
Taking only the 67 representative offices whose location of activities is registered as being “nationwide”, 37 (or 55.2%) have a State Council department or unit as their PSU. The remaining 30 have provincial-level government departments or units as PSUs, demonstrating that provincial-level government departments can act as PSUs for NGOs with nationwide activities.
The registration site of the representative offices with nationwide activities
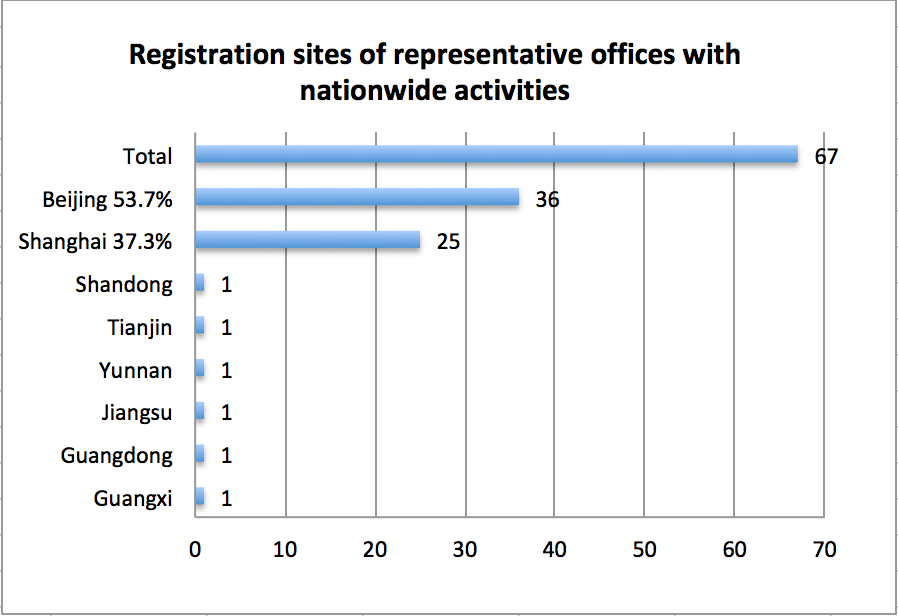
Looking at where the representative offices responsible for nationwide activities are registered, Beijing still takes first place with 36 offices, followed by Shanghai with 24. This suggests that most of the ONGOs engaging in nationwide activities that have a State Council PSU are based in Beijing.